User guide
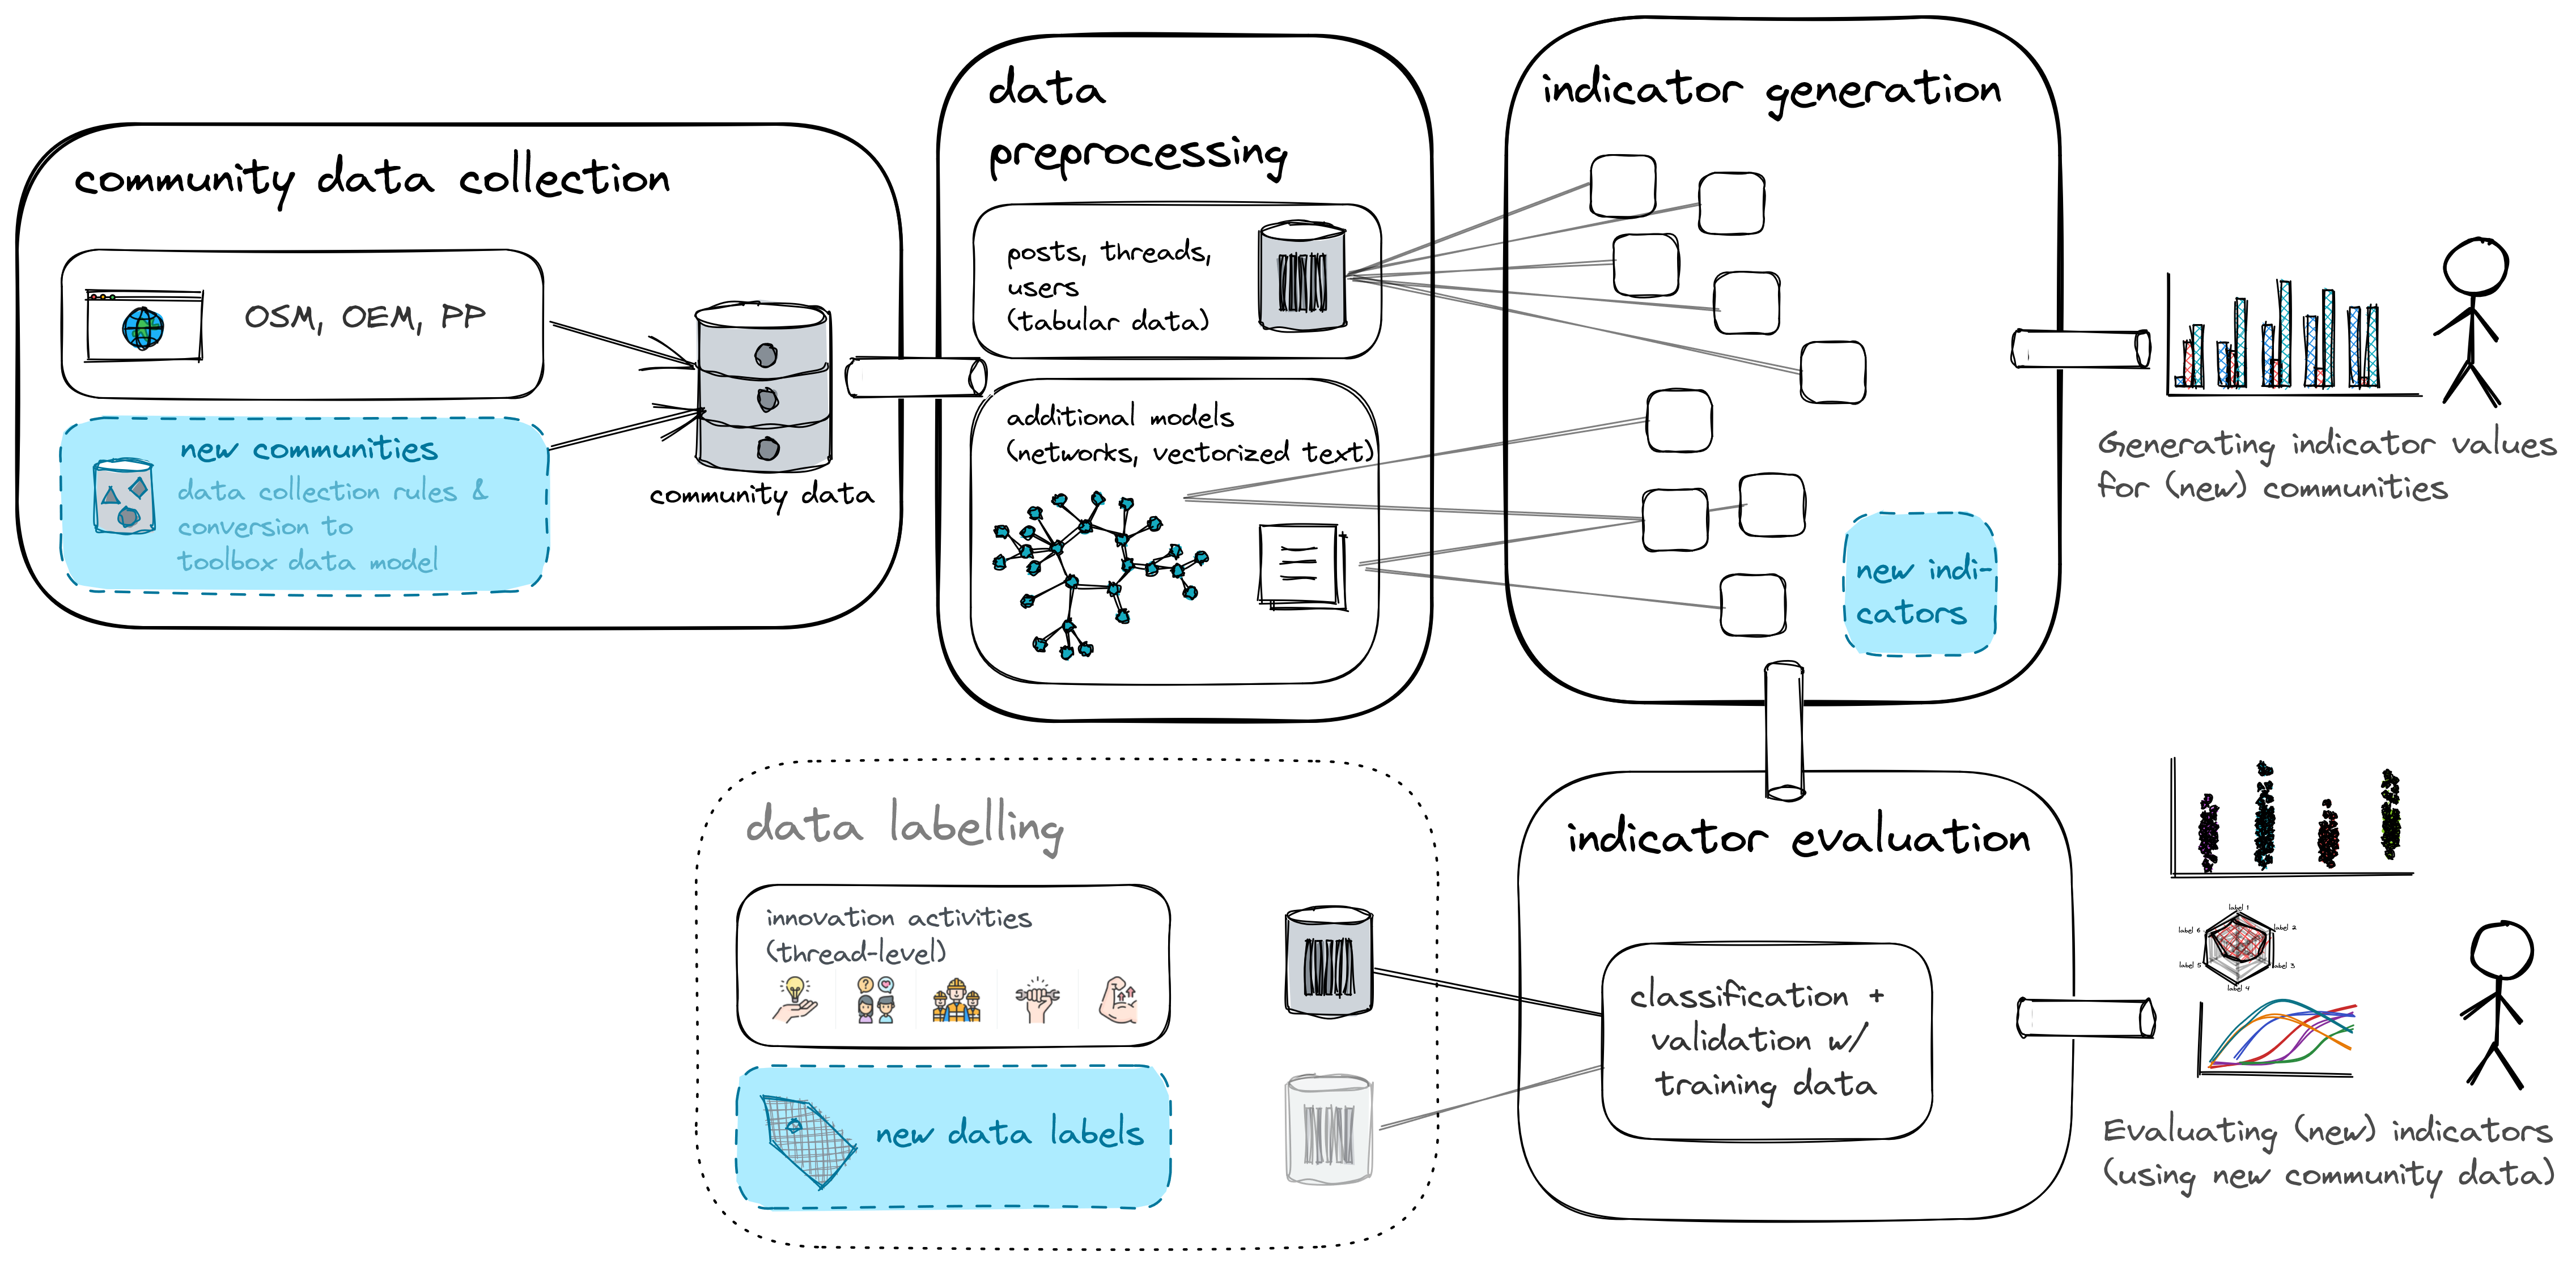
Community data collection
Brief description
The toolbox makes use of online forums as a data source for the investigation of peer communities. For further processing, the Toolbox requires a certain data structure that records the time of contribution, the text, a unique contributor and the associated thread for each forum post, where each post forms a data point. The data model links the table of individual contributions (posts) with a table of contributors (authors) and a table with information on the discussion threads. The three data tables form the basis for the analysis of online interactions in peer communities. The data required can be obtained using two approaches: Loading the data dynamically or from a static file. The data tables available as files correspond to the specified data structure. Alternatively, the data can be loaded dynamically from publicly accessible online forums via web scraping, a database or another interface (API). Thereby, appropriate adjustments must be made for each new data source. If the data of the forums of several communities are structured in the same way, e.g. because they use the same forum software (e.g. Discourse), they can be collected with a comprehensive query.
Example of Peer Innovation research project
For the research project, data was collected from the online forums of three peer communities to analyse their innovation activities: Precious Plastic, OpenEnergyMonitor and OpenStreetMap. All contributions in the forums of the communities were scrapped and analysed for the period from 01/2017 to 12/2019. In total, the data set comprises more than 200,000 contributions (in 20,000 threads) from 12,000 users. In the three communities examined, the dynamic data links have already been created. Thus, new data of the community forums can be loaded automatically from the internet on a regular basis.
Data preprocessing (Calculation of Networks)
Brief description
Based on the forum data, the toolbox calculates two different interaction networks: Directed and undirected network relationships between contributors. Thus, for the calculation of network metrics, different graphs are created, where the nodes of the networks refer to the contributors in the online forum, and the edges represent their interactions.
In this context, a distinction is made between co-contributors and commentators. The co-contributor network considers which contributors contribute to the same discussion (thread). There is an undirected relationship between two contributors sharing participation in a thread. The strength of the relationship increases with the number of threads shared. In contrast, the commenter network maps the contributions to discussions initiated by others. There is a directed relationship between commentators and the initial contributor of a thread. The strength of a relationship between two forum contributors increases with the number of comments by one contributor to the other's initial contributions.
Example of Peer Innovation research project
The research project examines online forum discussion threads as measurable manifestations of knowledge exchange in peer communities. The co-contributor networks map which community members exchange information with each other. The pooling of distributed knowledge and the recombination of experiences from different fields is considered a basic mechanism for the emergence of innovative ideas. The commenter network, on the other hand, maps directed knowledge flows within the peer community. Here, the focus is on who receives information and through whom. From this, conclusions can be drawn about the position of certain members and the significance of their contributions to the community.
Extension possibilities
There are other rules of network formation possible. For example, the respective positions of the posts in the threads could be taken into account. Furthermore, the contributors could be differentiated between established members and newcomers based on their previous history to examine community entry 1. Expanding the toolbox to include other network types is possible, but requires modification of the code.
Data labelling
Brief Description
A part of the data set must be labelled so that the supervised classification algorithm can be trained with it. For this part of the data, the relevance of the forum content must be defined, because the performance of the indicators is measured by this ground truth. The training data set can be created in different ways.
Example of Peer Innovation research project
The research project investigated how peer communities drive sustainable innovation. For this purpose, those processes were determined, which provide information about the further development and dissemination of sustainable technologies by the community. In the forum discussions, there is evidence of activities with which community members contribute to the innovation process: not only sharing blueprints and designs, but also testing and evaluating technical solutions, and pointing out alternatives or ways to overcome difficulties in implementation. So with the training dataset, the toolbox should detect indications of these multiple activities. The assessment of the prevalence of innovation activities and the innovation potential of the threads' content was manually conducted by the project team and outsourced using an online survey. For this purpose, rules were first defined 3, according to which the evaluators assigned labels to the threads. The evaluated threads were then used as training data for validating the suitability of the various metrics for identifying peer innovation. The quality of the training data can be assessed using interrator agreement metrics. In case of labeller disagreements, it was necessary to apply a rule on which labels to choose to finalize the shape of the training data.
Extension possibilities
The classification of forum content could also be based on completely different criteria, depending on the research interest and application context. As indications of innovation activities or innovation potential, other content-related criteria could be used for labelling as well, and labelling could also be carried out at other observation levels than the thread. For example, individual forum posts could also be evaluated. Furthermore, other innovation aspects than activities such as innovation inputs and outcomes could be focused on for identifying peer innovation.
Indicator generation
Brief Description
The indicator metrics implemented in the toolbox stem from the literature analysis conducted in the Peer Innovation project in the research context of open innovation and user innovation 2. These metrics are each assigned to different observation levels (initial idea, feedback, interaction). When adding further metrics, it must be taken into account to which level the new metric refers. An overview of the current implementations can be found here.
Example of Peer Innovation research project
The research project aims to validate suitable indicators for innovation activities in peer communities. Metrics that are associated with the occurrence of innovations in the research literature 2 are therefore calculated at the different observation levels. These metrics then can identify threads that contain indications of relevant activities, such as presenting, evaluating, implementing, modifying and improving innovative ideas.
Extension possibilities
Furthermore, additional metrics can be added to the toolbox by extending the indicator library. The procedure is explained in the [Examples for Creating a custom indicator]. A new metric must then be defined at the respective observation level. For example, additional text-based indicators could focus on certain keywords in the contributions or mark certain features in the contributors' response behaviour.
Indicator evaluation
Brief description
The toolbox uses supervised machine learning techniques to train classification models that combine the most suitable metrics for classifying forum content. The labelled presence or absence of innovation potential and activities per thread represent the target in the dataset for classification. Different parts of this data set are used to train the cross-validated classification model. The change in classification accuracy based on the inserted indicator metrics benchmarks their importance or explanatory power. In this way, suitable indicators and their best possible combination are selected for the automated detection of relevant content in the community forum.
Example of Peer Innovation research project
In the research project, the classification algorithm was trained with the manually labelled threads. Performing supervised feature selection, e.g., using recursive feature elimination methods such as boruta, returns a list of indicators suitable for classifying threads according to their degree of innovation. In this way, the previously generated metrics could be validated in terms of how well they can predict the occurrence of innovation activities in discussion threads.
Generating indicator values for (new) communities
The toolbox calculates key figures and network statistics from the forum data of the peer communities, such as the shares of occasional and core contributors or the network density. These values are used to compare and characterise the peer communities and their network structures.
Brief description
The forum data can be statistically evaluated with the toolbox for each peer community. The implemented metrics can be calculated and compared with the other peer communities to identify special features in the interaction structures. In addition, depending on the interest of the study, average values can be calculated for any period of time in order to investigate dynamic changes in the communities.
Example of Peer Innovation research project
In the research project, three peer communities were examined and described with the help of the implemented metrics. The investigations were limited to the period from 2017 to 2019 for better comparability of the communities. In the comparison of the values, clear differences between the communities became visible, which alligns with the qualitative research results from interviews with community members. For example, the network densities of the peer communities Precious Plastic, OpenEnergyMonitor and OpenStreetMap could be compared (based on the undirected graphs). One finding was that the Precious Plastic community has a comparatively high network density. The core of the community (the largest sub-group in which all have interacted with each other at least once) includes just under 10% of the participants. In contrast, however, there is also a large proportion of occasional users in the forum (more than 50%). More detailed examples as well as comparative tables can be found in the project's work report 3.
Extension possibilities
Extensions of the community comparisons are easily possible by adding forum data from other communities or defining alternative metrics. In addition, comparing the average values of different time periods offers another possibility for evaluation that was not pursued in the research project. Thus, on the one hand, the dynamic development of the communities could be examined or the effect of certain events or interventions on the communities could be evaluated.
Applying and evaluating indicator values to the entire data set
Brief description
The integration of the selection of suitable estimation models and indicators allows for the classification of the whole forum content. In this way, the relationships existing in the partial data set between the measurable characteristics and the relevance of the forum content are transferred to the community level. In this step, the trained classification models are applied to the entire data set in order to classify all the forum content extracted. Thereby, the automated evaluation learned from the training data is applied to all forum content. The results of the automated classification can in turn be evaluated and compared for individual communities, different time periods or sub-forums.
Example of Peer Innovation research project
In the research project, the trained models were used to estimate innovation activities of the peer communities in the forum data. The proportion of threads that are related to innovation activities or show a certain innovation potential could be determined automatically for the communities studied. However, the transferability of the estimation models between communities could not be examined more closely within the framework of the project.
Extension possibilities
The toolbox could easily be used to make comparative estimates for different time periods or sub-forums of the same community. In the future, the robustness of the estimates should be tested when transferring the models to different communities in order to enable automated classification without prior labelling.
-
Paxton, A., Varoquaux, N., Holdgraf, C., & Geiger, R. S. (2022). Community, Time, and (Con) text: A Dynamical Systems Analysis of Online Communication and Community Health among Open‐Source Software Communities. Cognitive Science, 46(5), e13134. ↩
-
Pohlisch, J. (2021). Measuring household sector innovation in online communities (Working Paper). ↩↩
-
Heß, P., & Gleu, A. (2022). Measuring peer innovation in online communities: Discussion pa-per for the expert workshop "How innovative are peer communities? Approaches to the empirical assessment of peer innovation" on 14 January 2022. ↩